For definitions of the indices and terms used below, please refer to our Explanation of LHX indices and terms.
Our interactive LHX Share Trading Index Graph now provides significant additional valuation data across our portfolio.
In addition to showing overall portfolio indexes, we now show separate Residential and Student indexes.
For the Residential indexes, we provide further detail, illustrating both Vacant Possession Value ("VPV") and Investment Value ("IV"). For each Residential property, both these valuations are found in Allsops' valuation reports on our site.
Historically, we have only shown the vast majority of our Residential valuations on the more conservative IV; this remains a relevant reference, but VPV is the prevailing basis on which units across the portfolio are being sold, so this additional data has increasing relevance to clients.
Highlights
The following is correct as of 30 September 2022. For the latest figures, view the LHX live.
-
- Residential property value, based on VPV (assessed by an independent RICS-approved surveyor), is 20.8% above purchase price
- Residential share value, based on VPV, is 17.6% higher than at acquisition; this is after purchase costs, deferred tax, mortgage finance and London House Exchange fees
- By comparison, Student share value is 1% lower than at acquisition, which is a significant reason for the lower overall portfolio performance, offsetting the stronger Residential valuations
Student vs Residential

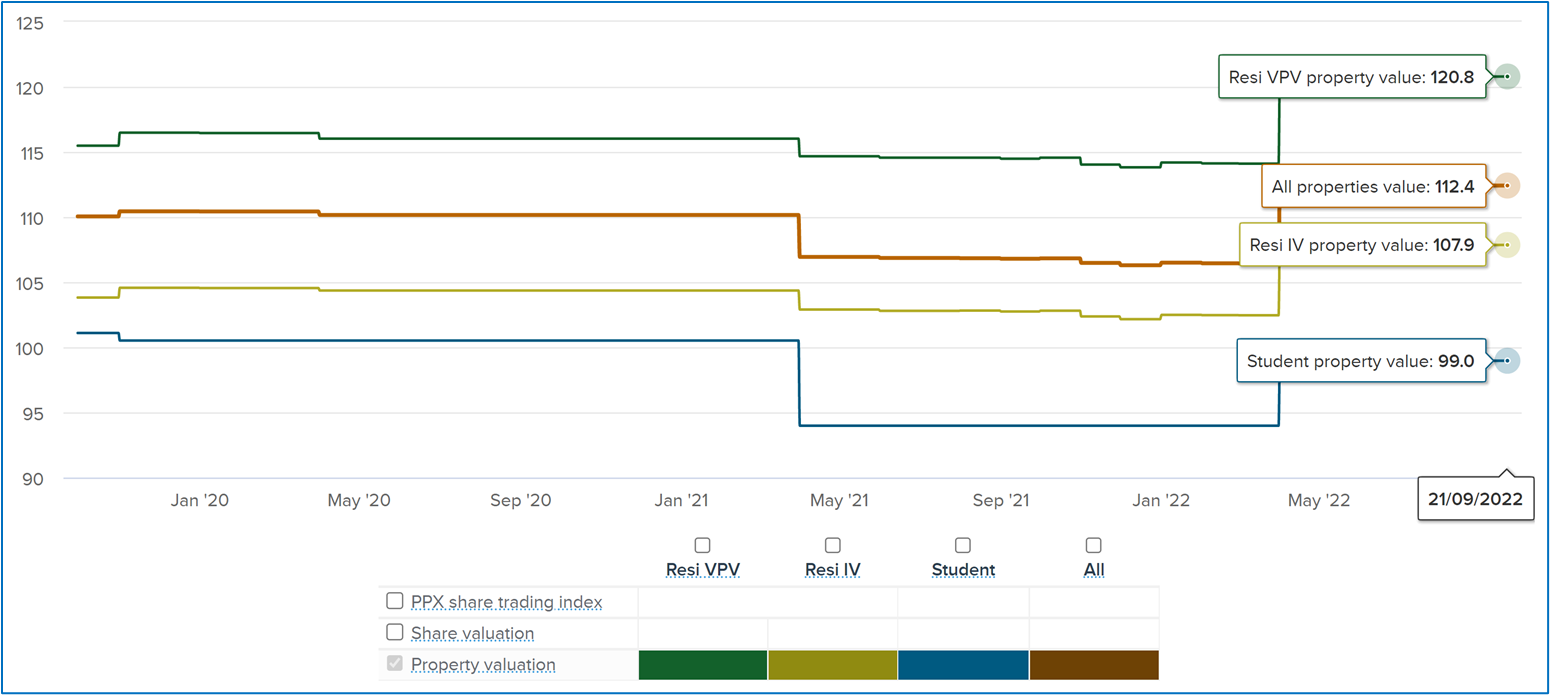
Until now, we have only shown the whole portfolio (orange line), for which independent property valuation is 12.4% higher than purchase price. This is a blended average of:
- Residential at VPV (green line) which is 20.8% higher than purchase price; and
- Student valuation (blue line) which is 1.0% lower than purchase price.
Residential VPV vs IV
Referring to the same graph above, until now, we have only shown (for the vast majority of properties) Residential valuations on the basis of IV (yellow line). This is 7.9% higher than purchase price; in comparison to Residential VPV (green line) which is 20.8% higher, the difference represents the typical spread of 10-15% between these valuation methods.
For definitions of these valuation methods, please refer to our Explanation of LHX indices and terms.
Share Valuation Index vs Property Valuation Index

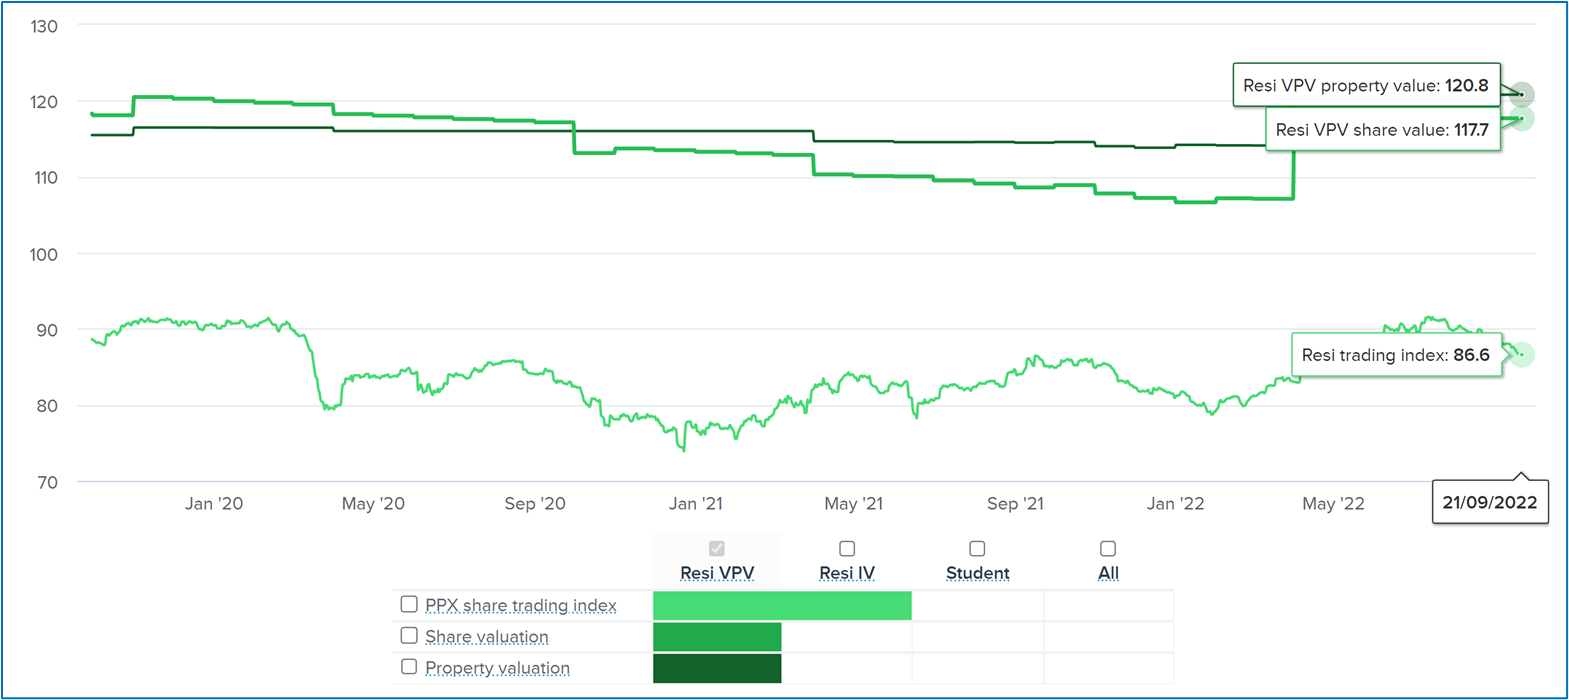
For each of Residential, Student and All properties, we show 3 lines (we illustrate with Resi VPV below):
- Property Value Index (dark green): independent surveyors value the property at 20.8% above purchase price
- Share Value Index (lighter green): using the above property valuation, share value adjusts for purchase costs, deferred tax, mortgage finance and Property Partner fees; compared to the initial listing price of all shares, they are up 17.7%
- Trading Index (light green): the weighted average share price at which investors are trading on the Resale Market; this line is comparable to the Share Value Index and shows that shares are trading 31.1 points below their independent valuation
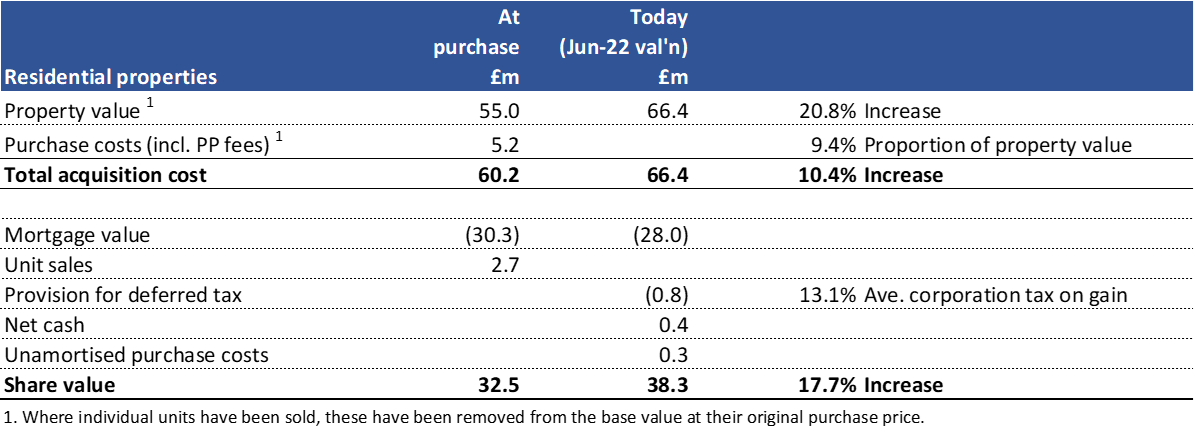
To understand how Property Value is adjusted to reach Share Value, please see the calculation below:

Comments
0 comments
Article is closed for comments.